


7 outbound sales metrics we review every week for 120+ B2B clients
TL;DR: Outbound sales metrics by the numbers
- Vanity Metrics: Skip open rate, click rate, and total sends. None of them predict revenue or catch problems early.
- Reply Rate: 2.5-4% is healthy. Below 1.5% means the list or copy is broken.
- Lead Rate: 1-2% positive replies is good. Below 0.5% signals wasted spend on unqualified interest.
- Bounce Rate: Keep it under 3%. Above 8% can burn a sending domain within weeks.
- Unsubscribe Rate: Stay under 1%. Above 3% means the ICP or cadence needs a rework.
- Spam Complaints: Keep under 0.2%. Above 0.3% risks Gmail and Microsoft throttling the domain.
- Booking Rate: 30-50% of leads should convert to meetings. Below 20% points to follow-up, not targeting.
- Cost Per Lead: $50-150 is healthy. Above $300 means something in the system is broken.
We review outbound sales metrics on every client account, every single week, and open rate has never made the cut (neither has total sends, no matter how good it looks on a slide).
Both metrics feel productive, yes, but… neither tells you if the campaign actually made anyone money 😅
What we track instead is a shorter, more honest list: 7 numbers that predict revenue, catch a problem while it's still cheap to fix, and tell us exactly when to pause a campaign before it torches a sending domain.
It's the same scoreboard behind week-long SaaS deals and eighteen-month M&A engagements, starting with the one distinction most reports skip.
What's the difference between vanity metrics and revenue metrics in outbound sales?
Vanity metrics measure activity you can see, like opens, sends, and clicks.
Revenue metrics measure activity that predicts money, like qualified replies, booked meetings, and cost per lead.

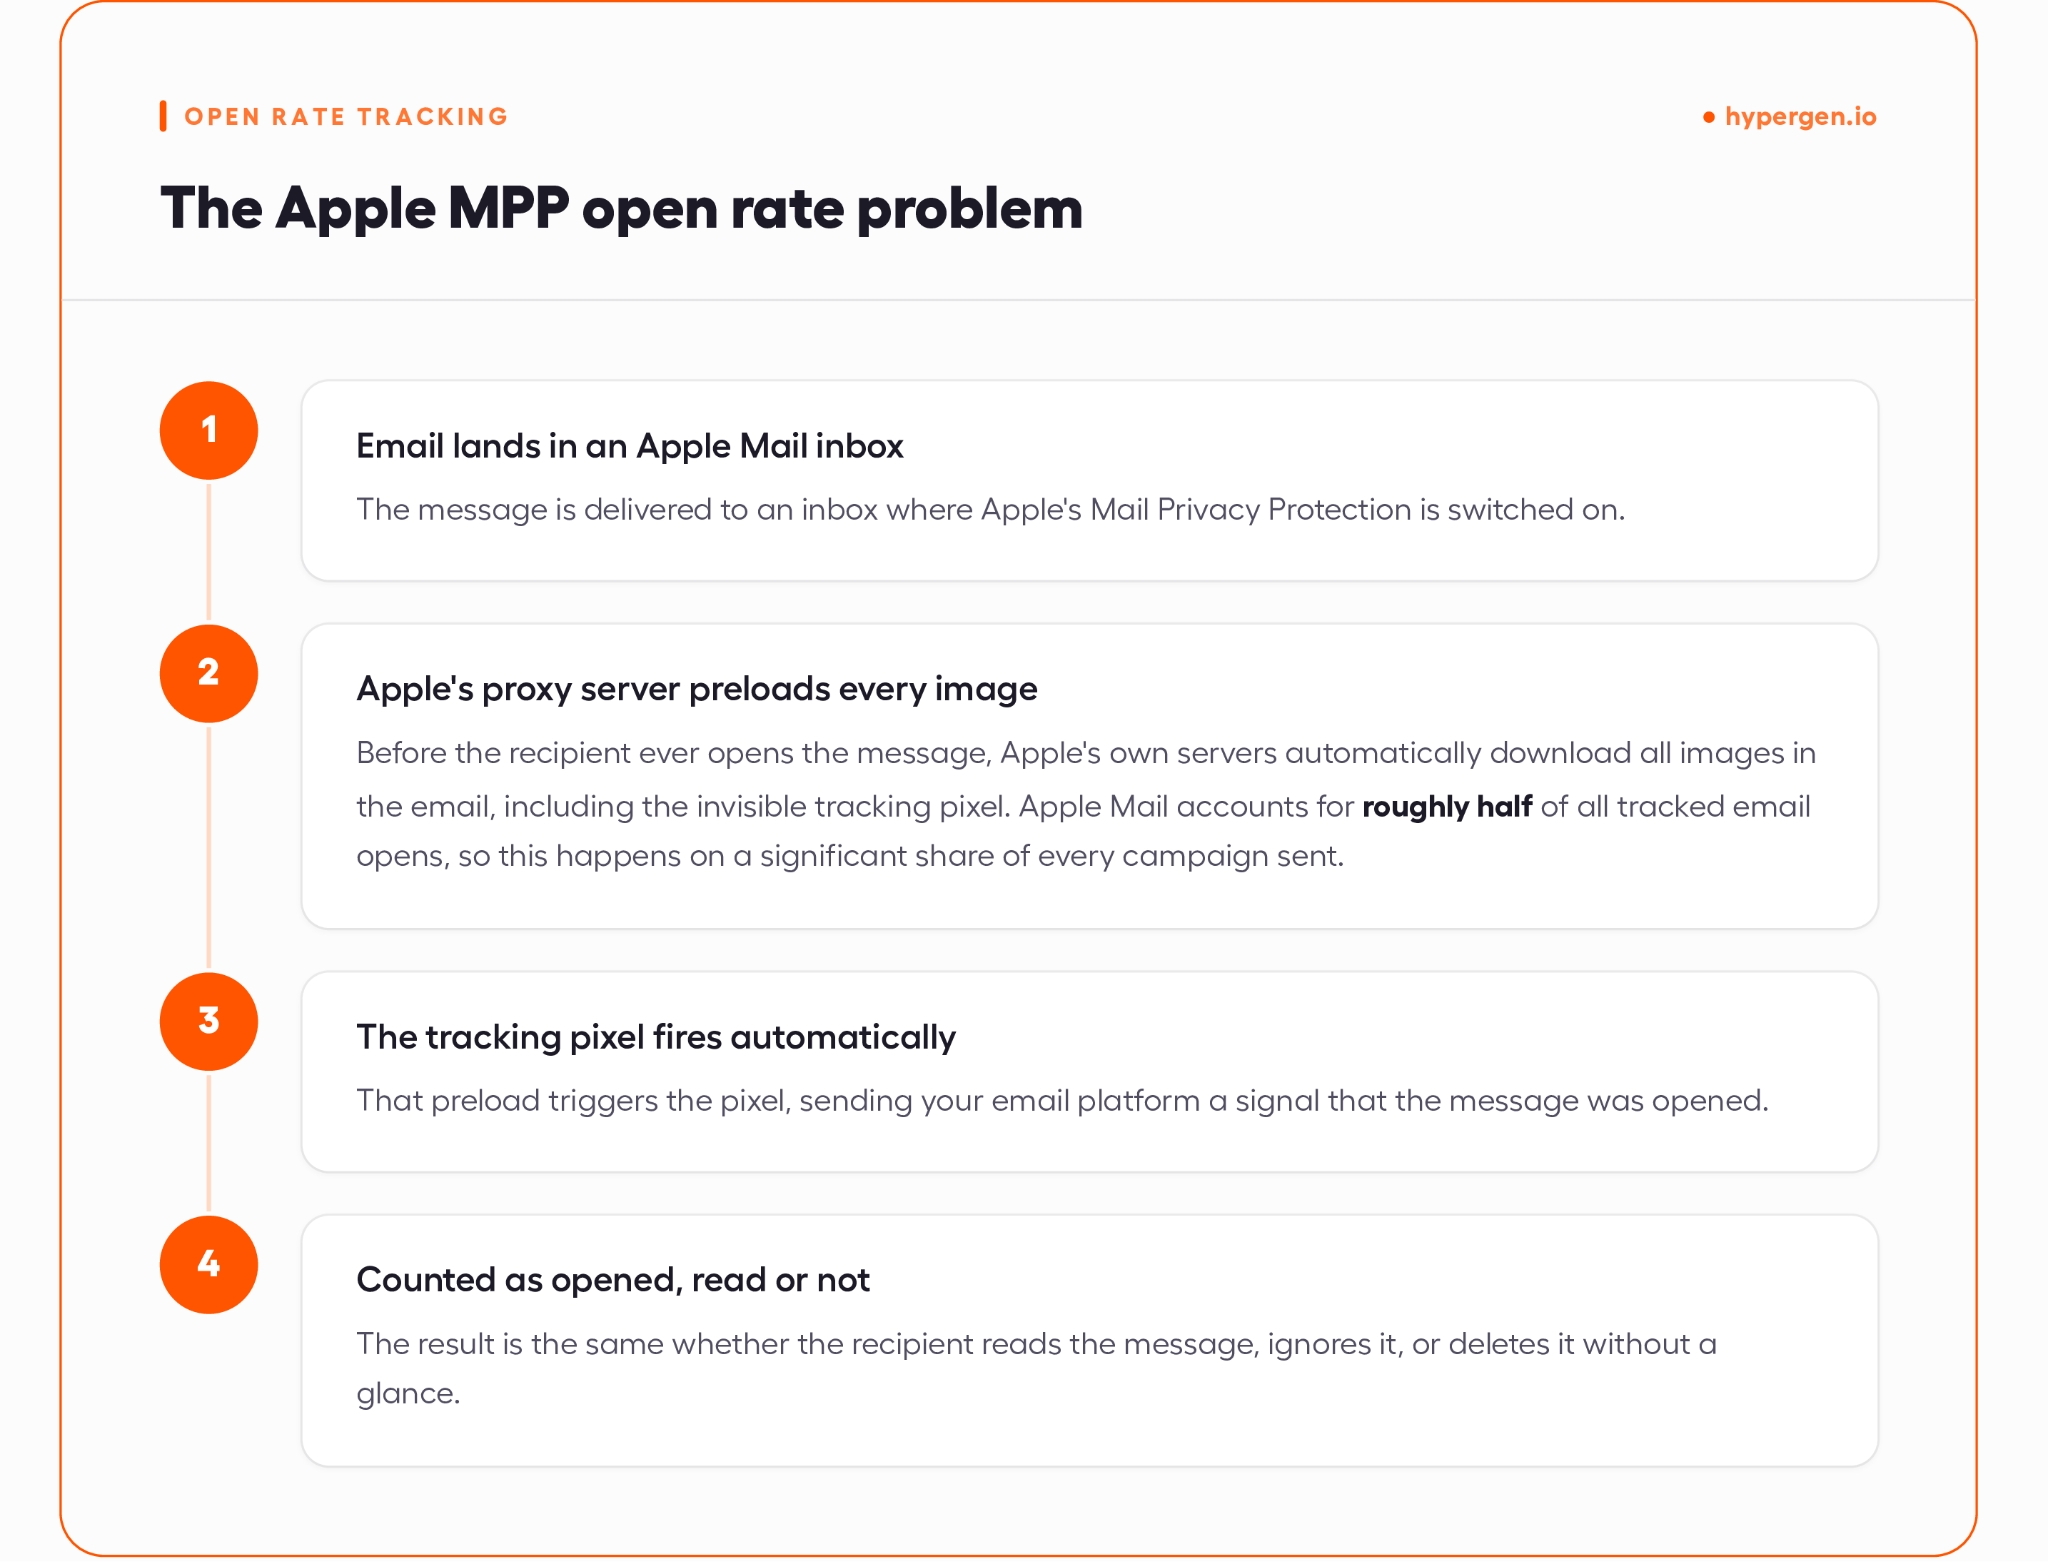
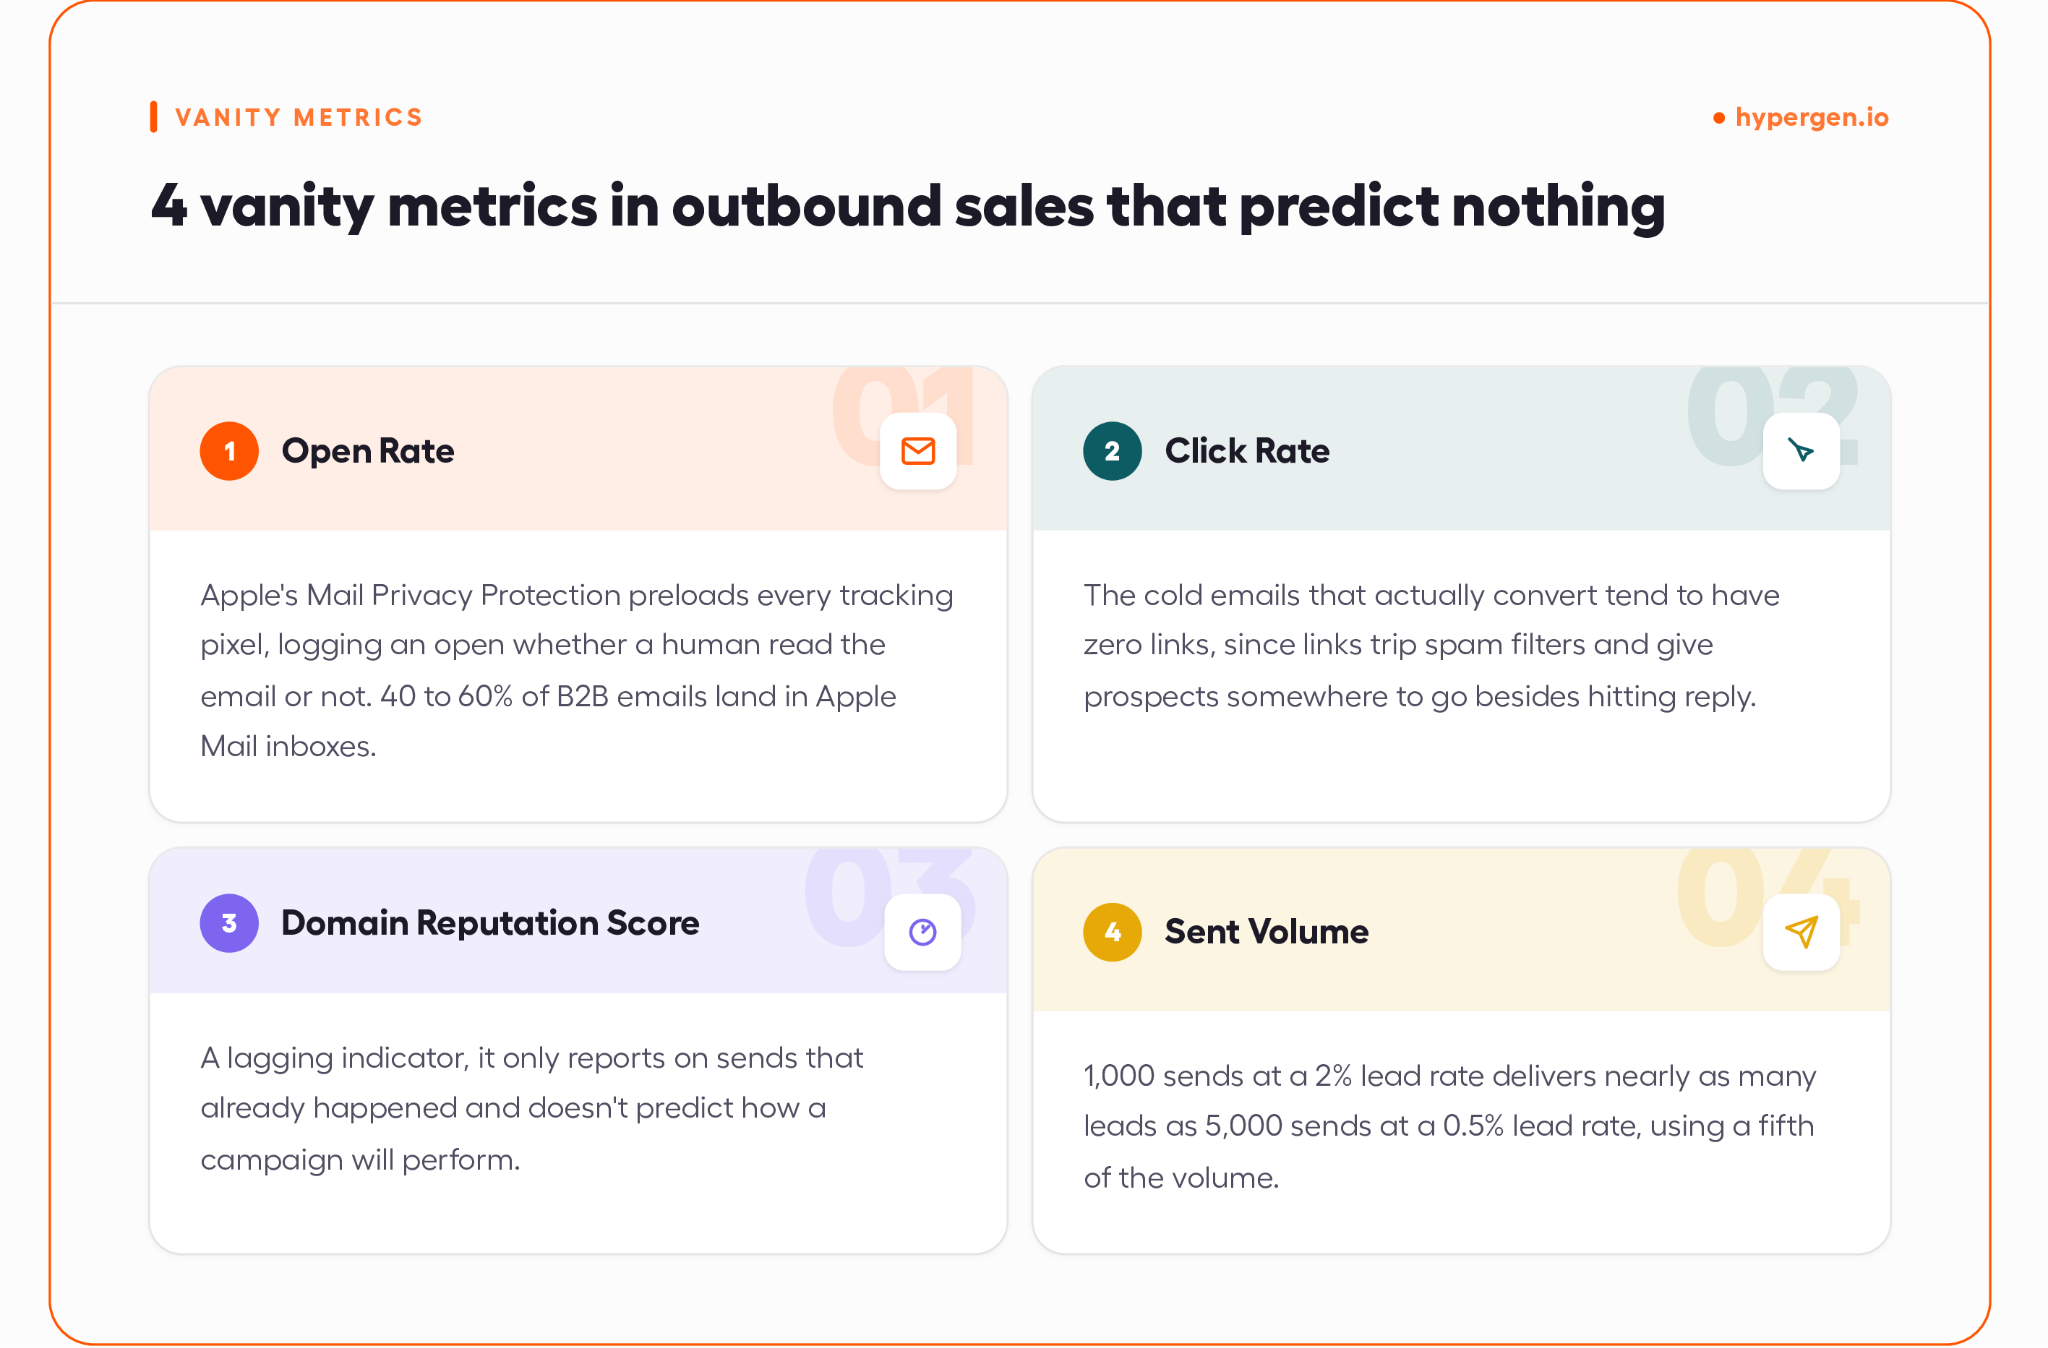
Open rate is the clearest example: Apple's Mail Privacy Protection preloads tracking pixels for roughly half of all email opens, whether a human actually read the message or not.
And here's a pattern we run into more often than you'd think 👀:
We've had two very different clients show up equally proud of their open rate, and the number meant two completely different things underneath.
- One had an 18% open rate and a 0.4% reply rate. That gap told the whole story: most of those "opens" were Apple's proxy servers automatically loading images, not humans reading the email, and it turned out roughly 80%of their sends were quietly landing in spam.
- Another had a much lower open rate but a solid 3.2% reply rate, meaning real inboxes and real humans behind it.
As you can see, that the same metric on paper, but a completely different reality underneath it.
Worth clarifying: Apple's Mail Privacy Protection preloads tracking pixels for roughly 52% of all email opens. Which means that over half your "open rate" is potentially just being a proxy server saying hello.
This comes up in maybe 3 out of every 10 new client kickoffs (it's basically a rite of passage at this point 🙃).
A client asks why open rate isn't in the weekly report, and we walk through the same math every time:
If 15% of people supposedly "opened" an email but only 0.8% replied, those opens didn't prove anything actually happened.
And we'd rather hand over three real signals instead: reply rate, bounce rate, and a manual weekly inbox placement check, where we send test emails into Gmail, Outlook, and Apple accounts and see exactly where they land.
Honestly, this is one of the first things worth asking about if you're trying to evaluate a cold email agency you haven't worked with yet: ask what they've chosen not to report, not just what they are.
A very common mistake: Click rate has the same problem in reverse. Most cold emails that actually convert have zero links in them (links trip spam filters and give the prospect somewhere to go besides hitting reply). Which means that an 8% click rate sounds impressive until you realize every click is a reply that didn't happen.
Total emails sent is the third vanity metric worth naming, and one we get pushback on almost as often as open rate.
- 10,000 emails at a 0.5% lead rate → 50 leads
- 2,000 emails at a 2% lead rate → 40 leads, at roughly a fifth of the cost
That's why every metric from here on measures an outcome, not an activity.
Here's the full list of numbers we've chosen not to report, and why each one fails to predict revenue.
What's a good reply rate for outbound sales campaigns?
A good reply rate for B2B outbound sits between 2.5% and 4.0%. Below 1.5% is a red flag that your list or your copy is broken. And above 5% is excellent.
Reply rate is the earliest signal in the funnel, and it tells you whether the message is resonating before you know whether the people replying are worth anything.
A reply rate stuck under 1.5% almost always traces back to one of these:
- The copy reads like a template blast, not a message written for a specific person
- The list is reaching the wrong titles, wrong company size, or the wrong industry entirely
- There's a quiet deliverability issue on the domain, so even decent copy never gets a fair shot
This is why we treat reply rate as a diagnostic tool. If it's low, the fix is almost always the message or the targeting, not sending more emails.
Good cold email personalization tends to move this number more reliably than any subject line trick we've ever tested (and trust us, we've tested plenty).
Reply rate also depends heavily on persistence.
A campaign that gives up after one email is judging itself on incomplete data, since a meaningful chunk of replies show up on the second or third touch, not the first.
Which is why building a proper follow-up emails after no-response after silence is genuinely one of the cheapest ways to lift this number, and you don't even have to touch the original copy.
So reply rate answers "is anyone responding at all?", but it doesn't tell you if they're the right anyone.
That's where lead rate is for.
What is a good lead rate (positive reply rate) for B2B outbound?
A good lead rate, meaning positive replies from prospects who actually want to talk, sits between 1.0% and 2.0%. Below 0.5% is a red flag. And above 2% is excellent.
Lead rate is what happens when you multiply reply rate by qualification rate, so a 4% reply rate paired with a 0.5% lead rate means most of that interest is coming from people who were never going to buy.
This is the metric that matters most to the people paying the retainer.
Reply rate tells you the copy is landing somewhere, but lead rate tells you if it landed in front of the right person.
📚 Worth a read: Clay prospecting: how we find high-intent B2B leads
A campaign built around genuinely high-quality leads shows this pretty quickly: reply rate and lead rate track each other closely, instead of one climbing while the other stays flat.
And this is usually the first thing we point to when a client asks why their old vendor's numbers "looked fine" but somehow never turned into real pipeline.

If you only have room for one number on a dashboard, make it lead rate, not reply rate. It's the one that's actually closest to revenue.
Once lead rate looks healthy, the next place worth checking is list quality, since none of this matters much if bounce rate is quietly wrecking your email sender reputation in the background.


What bounce rate should make you pause a cold email campaign?
A healthy bounce rate stays under 3%. Above 5% is a red flag and above 8% should stop a campaign immediately, since a high bounce rate can burn a sending domain within two to four weeks.
Real example:
We had a client bounce 12% in their very first week on a brand new list.
What we did: we paused that same day, scrubbed the entire list, and relaunched at a much healthier 2.1%.
A bounce rate creeping past 5% almost always comes down to one of these:
- A list bought or scraped without real-time email verification
- Contacts that haven't been touched, updated, or re-checked in six months or more
- A data source that skips MX record checks before handing contacts over

Bounce rate compounds fast. A domain that bounces at 8% one week doesn't just lose that week's sends, it damages sender reputation for every single campaign that follows it. That's the entire logic behind pausing immediately.
We've also traced bad bounce rates back to the outbound prospecting method itself, not just an aging list, especially when the data source scrapes contacts without ever verifying them against a live mail server.
Once your list is clean and bounces are under control, unsubscribe rate is the next thing worth watching, since it points to a completely different kind of problem.
What unsubscribe rate signals a targeting problem?
An unsubscribe rate under 1.0% is healthy. Above 2% is a red flag and above 3% should trigger a pause and a full audit.
Unsubscribes are an early warning signal for message-market fit: a rate this high usually means the ICP is wrong, or the cadence reads as spam rather than outreach.
A rising unsubscribe rate usually points to one of these:
- The ICP is wrong, so the message never had a real shot at being relevant
- The cadence repeats the same ask without adding anything new
- The same list segment is being contacted too many times in too short a window
Unlike bounce rate, which is a data problem, unsubscribe rate is a relevance problem.
And beyond relevance a hard-to-find unsubscribe often becomes a spam complaint instead.
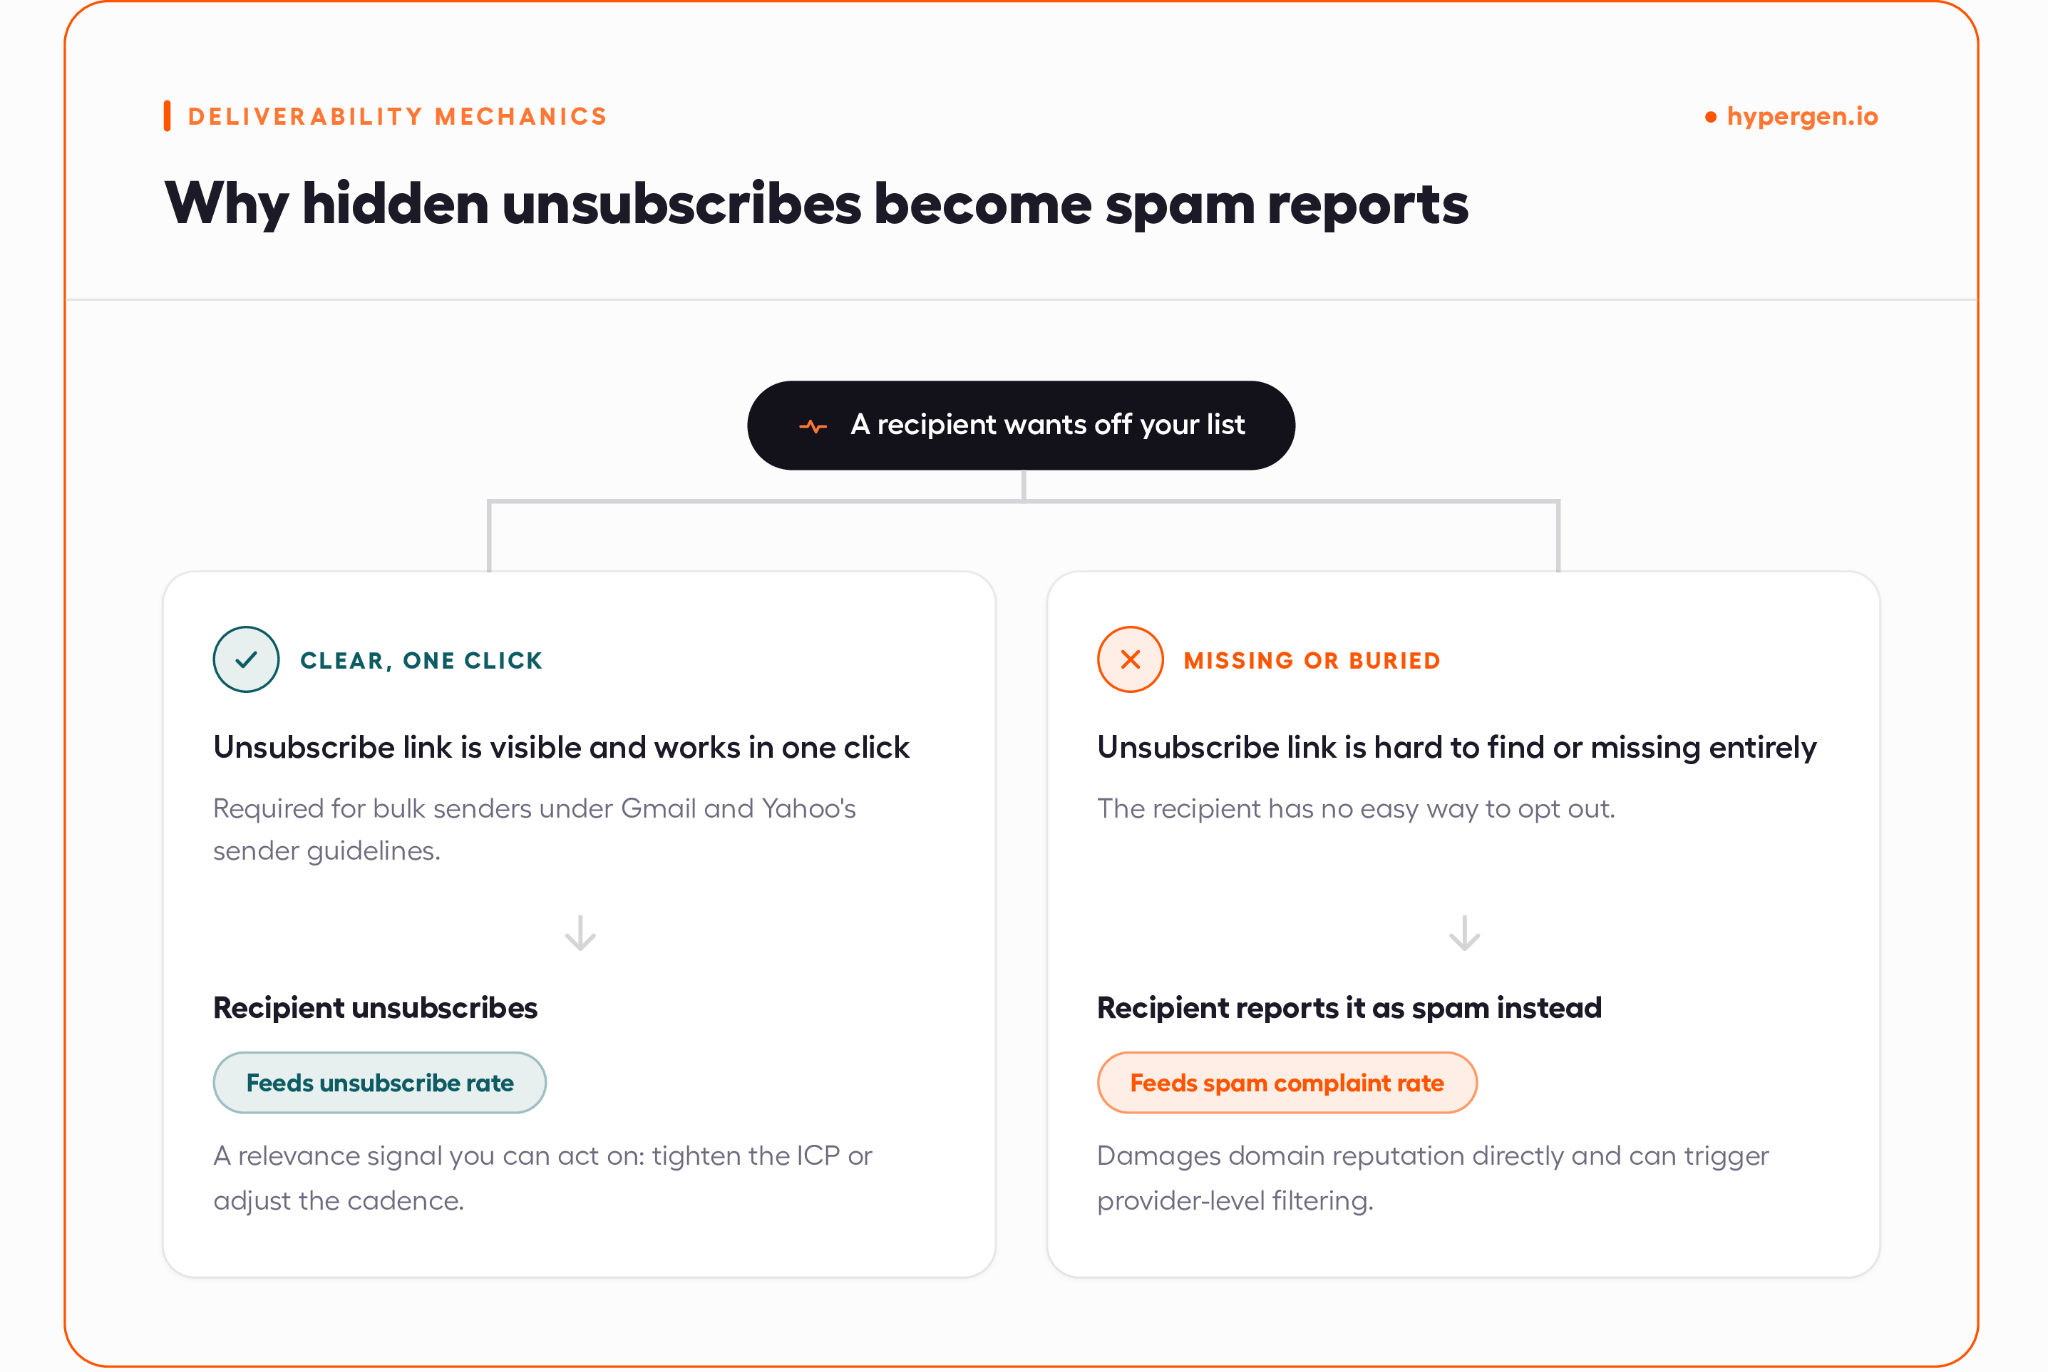
People who open the email, read it, and still choose to opt out are telling you something specific: this message wasn't for them. That's different from a bounce, which never reached a human being at all.
When we see unsubscribe rate creeping up on an otherwise clean list, the fix almost always lives in ICP targeting, not deliverability.
A rising unsubscribe rate is one of the clearest early signals that a cadence has drifted from "helpful outreach" into "please stop emailing me." If the third or fourth touch in a sequence still isn't landing, sending a fifth one won't fix it.
📚 We go deeper on this here: 9 еffective outbound lead generation tactics + examples and 12 essential email deliverability best practices
And speaking of metrics that need immediate attention though, the next one has zero tolerance for waiting.
What spam complaint rate puts your sending domain at risk?
A spam complaint rate under 0.2% is safe. Above 0.3% is a red flag that should trigger an immediate pause, and above 0.5% puts the domain itself at risk.
One complaint per 1,000 sends can be enough to route future sends straight to spam. Which means that out of everything on this list, this is the metric with the least room for error 😬
A reply counts as hostile, not just uninterested, when it sounds like one of these:
- "Take me off this list"
- "How did you get my email"
- Anything that signals irritation rather than a simple no thanks
We treat hostile replies as an early read on tone and targeting, catching the problem before it ever escalates into an actual spam complaint.
Protecting sender reputation this closely is exactly why we always build and manage our own cold email infrastructure and of course, never sending from a client’s primary domain.
Recovering from a spam-flagged domain takes far longer than avoiding one in the first place, and that's really the entire case for treating 0.3% as a hard stop.
So this is the one metric where "we'll fix it later" genuinely isn't an option.
Once deliverability is solid (clean bounces, low complaints, all of it), the next question becomes whether those well-placed emails are actually turning into meetings.
What is a good meeting booking rate for B2B leads?
A healthy meeting booking rate turns 30% to 50% of qualified leads into booked meetings. Below 20% is a red flag and above 60% is excellent.
And this is also the metric that is the bridge between marketing and sales: a strong lead rate paired with a weak booking rate usually points to a client-side follow-up problem, not an outbound one.
We've seen accounts where lead rate looked strong at 2%, genuinely solid numbers, but booking rate was stuck around 10%.
And no, that was not an outbound problem.
The campaign was doing exactly what it was supposed to do.
But the bottleneck was entirely on the client's side, replies just weren't getting followed up on fast enough to matter. Their founder was fielding every reply personally and not following up fast enough.
So by the time he wrote back, the prospect had moved on.
If booking rate is stuck, these are the first three things worth checking:
- How fast someone actually replies once a lead comes in
- Who owns responding, and whether they're doing it consistently
- Whether the ask in that reply is specific (a real time and date) or vague, like "let's connect soon"
This is also why B2B appointment setting deserves attention on it’s own. As generating genuine interest and turning that interest into a calendar invite are two completely different jobs.
Booking rate is also where the case for follow-up speed gets made in real dollars, not just theory. Some clients solve it by outsourcing the SDR function entirely rather than piling more outbound volume on top of a follow-up process that's already the actual bottleneck.
So before you touch targeting or copy again, check booking rate first… it might save you a lot of wasted effort chasing the wrong fix.
Which brings us to the metric that ties everything else on this list together: what all of this actually costs.
How do you calculate cost per lead for outbound sales?
Cost per lead is calculated as monthly retainer divided by leads generated. A good range is $50 to $150 per lead. Above $300 is a red flag and under $50 is excellent.
Let's actually run the math, because it's more useful than just quoting a range:
Take a $5,500 monthly retainer, divide it by 40 leads generated, and you land at $137.50 per lead.
Now stretch that number a little further, because cost per lead on its own only tells half the story:
- If the average deal is worth $50,000
- And closes at a 5% rate
- Then $137.50 per lead works out to roughly $2,750 to acquire that $50,000 client
- Which lands at a 5.5% CAC ratio (a genuinely healthy number, for what it's worth)
Cost per lead isn't just a report, but we treat it as a decision rule.
Under $100 per lead: we're comfortable adding volume.
But above $250: something in the system is broken and needs fixing before another dollar goes toward sending more emails.
Yet too many agencies present cold email ROI as "meetings delivered" without ever connecting that number back to what those meetings actually cost to produce.
Cost per lead is the only metric on this whole list that answers "should we scale this, or fix this?" Every other metric here diagnoses a problem.
This is really the whole argument for skipping open rate and total sends from the start.
A busy dashboard and a profitable outbound program are two very different things, and the only way to tell them apart is by tracking what actually predicts revenue instead of what's easiest to screenshot.
Seven sales metrics, checked the same way every week, will tell you more about the health of an outbound program than any report full of opens and impressions ever could.
Frequently asked questions
Most B2B outbound sequences need somewhere between 6 and 12 touchpoints to book a first meeting, which still surprises people the first time they hear it. Top-performing reps tend to book meetings in around 5 touches on average, while everyone else needs closer to 8. A good chunk of replies come from the second or third touch, not the first, which is exactly why a solid follow-up sequence matters as much as the opening email.
The clearest signal is a mismatch between two adjacent metrics, not a single bad number. A high reply rate paired with a low lead rate means the message is landing with the wrong audience, since interest isn't converting into qualified prospects. A strong lead rate paired with a weak booking rate points the other way, to a client-side follow-up problem rather than an outbound targeting issue. Reading metrics in pairs, not isolation, tells you which side of the funnel actually needs fixing.
Weekly is the right cadence for the core 7 metrics, frequent enough to catch a kill switch threshold before a domain burns, but not so frequent that normal day-to-day noise looks like a trend. Kill switch thresholds like an 8%+ bounce rate or 0.5%+ spam complaint rate warrant an immediate pause the moment they're spotted, regardless of the weekly cycle.
A healthy reply rate with a low lead rate almost always points to targeting, not copy. Since lead rate equals reply rate multiplied by qualification rate, a good reply rate with a weak lead rate means people are responding who were never going to buy, often out of curiosity, politeness, or simple confusion about who you are. The fix is usually tightening the ICP or the signals used to build the list, not rewriting the email again.
Yes. Enterprise and M&A buyers convert at a lower but still healthy 0.6% to 1.5% lead rate, compared to 0.8% to 2% for SaaS, and take 30 to 90 days between first reply and meeting instead of 3 to 7 days. Reply sentiment also shifts toward more timing qualifiers, which should be tracked as future pipeline rather than treated as a soft no the way a faster-moving SaaS deal would be.
Don’t miss these
.avif)
Get your first lead this month
14 days to get started. 7 days to get your first lead on average.


